Resample Oversample
When estimating the number of particles in a given region, you have to decide how much to sample. This depends on the heterogeneity of the particles and the desired precision. While you cannot control heterogeneity, you can control how much is sampled: Sample enough to get the desired precision, but not so much that excessive time is invested.
Use this command to assess the precision of the estimate obtained with the Optical Fractionator or the Physical Fractionator.
To gauge the precision of your estimate, oversample a representative animal from each group as part of your pilot study:
- Make your disector spacing and section interval two to three times less than you would normally use to sample the region. That is, choose parameters that you expect to sample all of the salient features of the tissue, and double or triple the amount of sampling.
![]() If skipping every 10th section is expected to sample the tissue and result in your desired precision, decrease the interval to every 5th or every 3rd section for the oversampled animal to increase the number of slides examined.
If skipping every 10th section is expected to sample the tissue and result in your desired precision, decrease the interval to every 5th or every 3rd section for the oversampled animal to increase the number of slides examined.
Use this oversampled animal to resample the data.
- Stereo Investigator generates a graph displaying the section interval vs. the estimates for those intervals, and a graph displaying disector spacing vs. the estimates for those disector spacings.
- Resample Oversample examines your data and provides the estimates not only for the initially oversampled data from your pilot animals, but also for cases where the disector spacing or section interval is greater.
- You will need all probe runs from an entire region of interest.
- You must have Microsoft Excel 2003 or later installed to use this command.
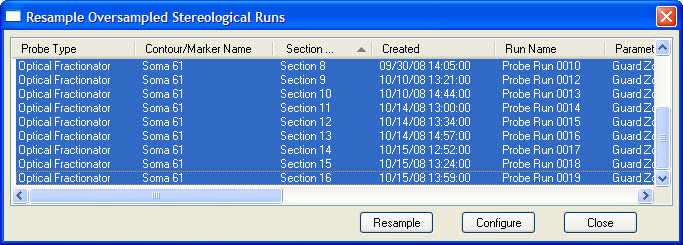
- Click Probes>Resample Oversample. Stereo Investigator displays the Resample Oversampled Stereological Runs dialog box
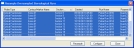 .
. - Select all the sections for the resampled region.
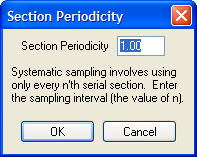
- Click Resample. Stereo Investigator displays the Section Periodicity dialog box.

- If you wish, change the periodicity. Click OK. Stereo Investigator begins the resample oversample process.
- When complete, Stereo Investigator opens a Microsoft Excel workbook with the results.
Stereo Investigator opens a Microsoft Excel workbook with your results in the following sheets:
Estimated population using mean section thickness where the estimates are generated from varying the sequence of counting sites included in the estimate.
Estimated population using mean section thickness where the estimates are generated from varying the interval of sections included in the estimate.
Estimated population using mean section thickness calculated from counting sites with counts. The population estimates are generated from varying the interval of counting sites included in the estimate.
Estimated population using mean section thickness calculated from counting sites with counts. The population estimates are generated from varying the interval of sections included in the estimate.
Estimated population using number weighted section thickness calculation from counting sites with counts. The population estimates are generated from varying the interval of counting sites included in the estimate.
Estimated population using number weighted section thickness calculation from counting sites with counts. The population estimates are generated from varying the number of sections (via the section interval) included in the estimate.
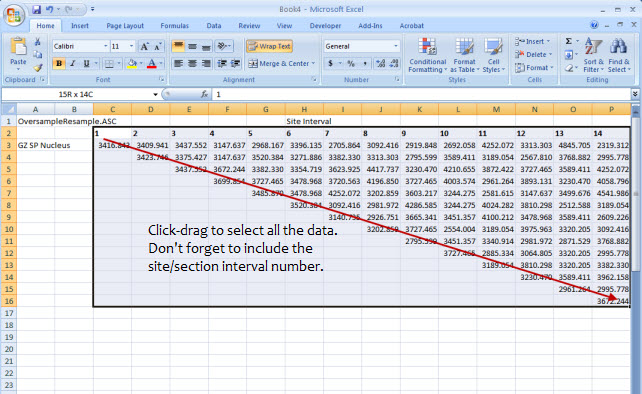
- In Microsoft Excel, click the Mean Est. by Site.
- Starting at the number 1, highlight all the data from that column to the last column, as shown below:

- Click Insert>Scatter chart. Microsoft Excel inserts a scatter chart of your data.

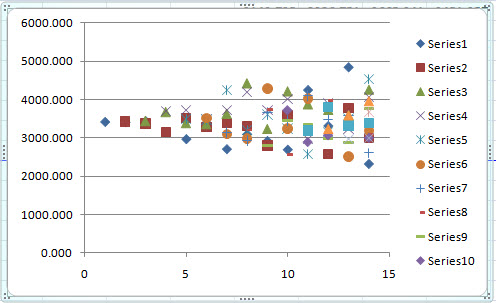
![]() You can also generate graphs for the other tabs. Examine these graphs and identify the values that provide the right balance between precision and time invested.
You can also generate graphs for the other tabs. Examine these graphs and identify the values that provide the right balance between precision and time invested.
References
Slomianka, L., & West, M.J. (2005). Estimators of the Precision of Stereological Estimates: An Example Based on the CA1 Pyramidal Cell Layer of Rats. Neuroscience 136(3), 757–767.
Stereo Investigator 11 | MBF Bioscience Support Center | Downloads